
In the cryptocurrency market, early-stage tokens rarely balance stability, productivity, and tradability. Most projects experience significant price volatility, modest yield structures, or unsustainable reward emissions that eventually pressure market value.
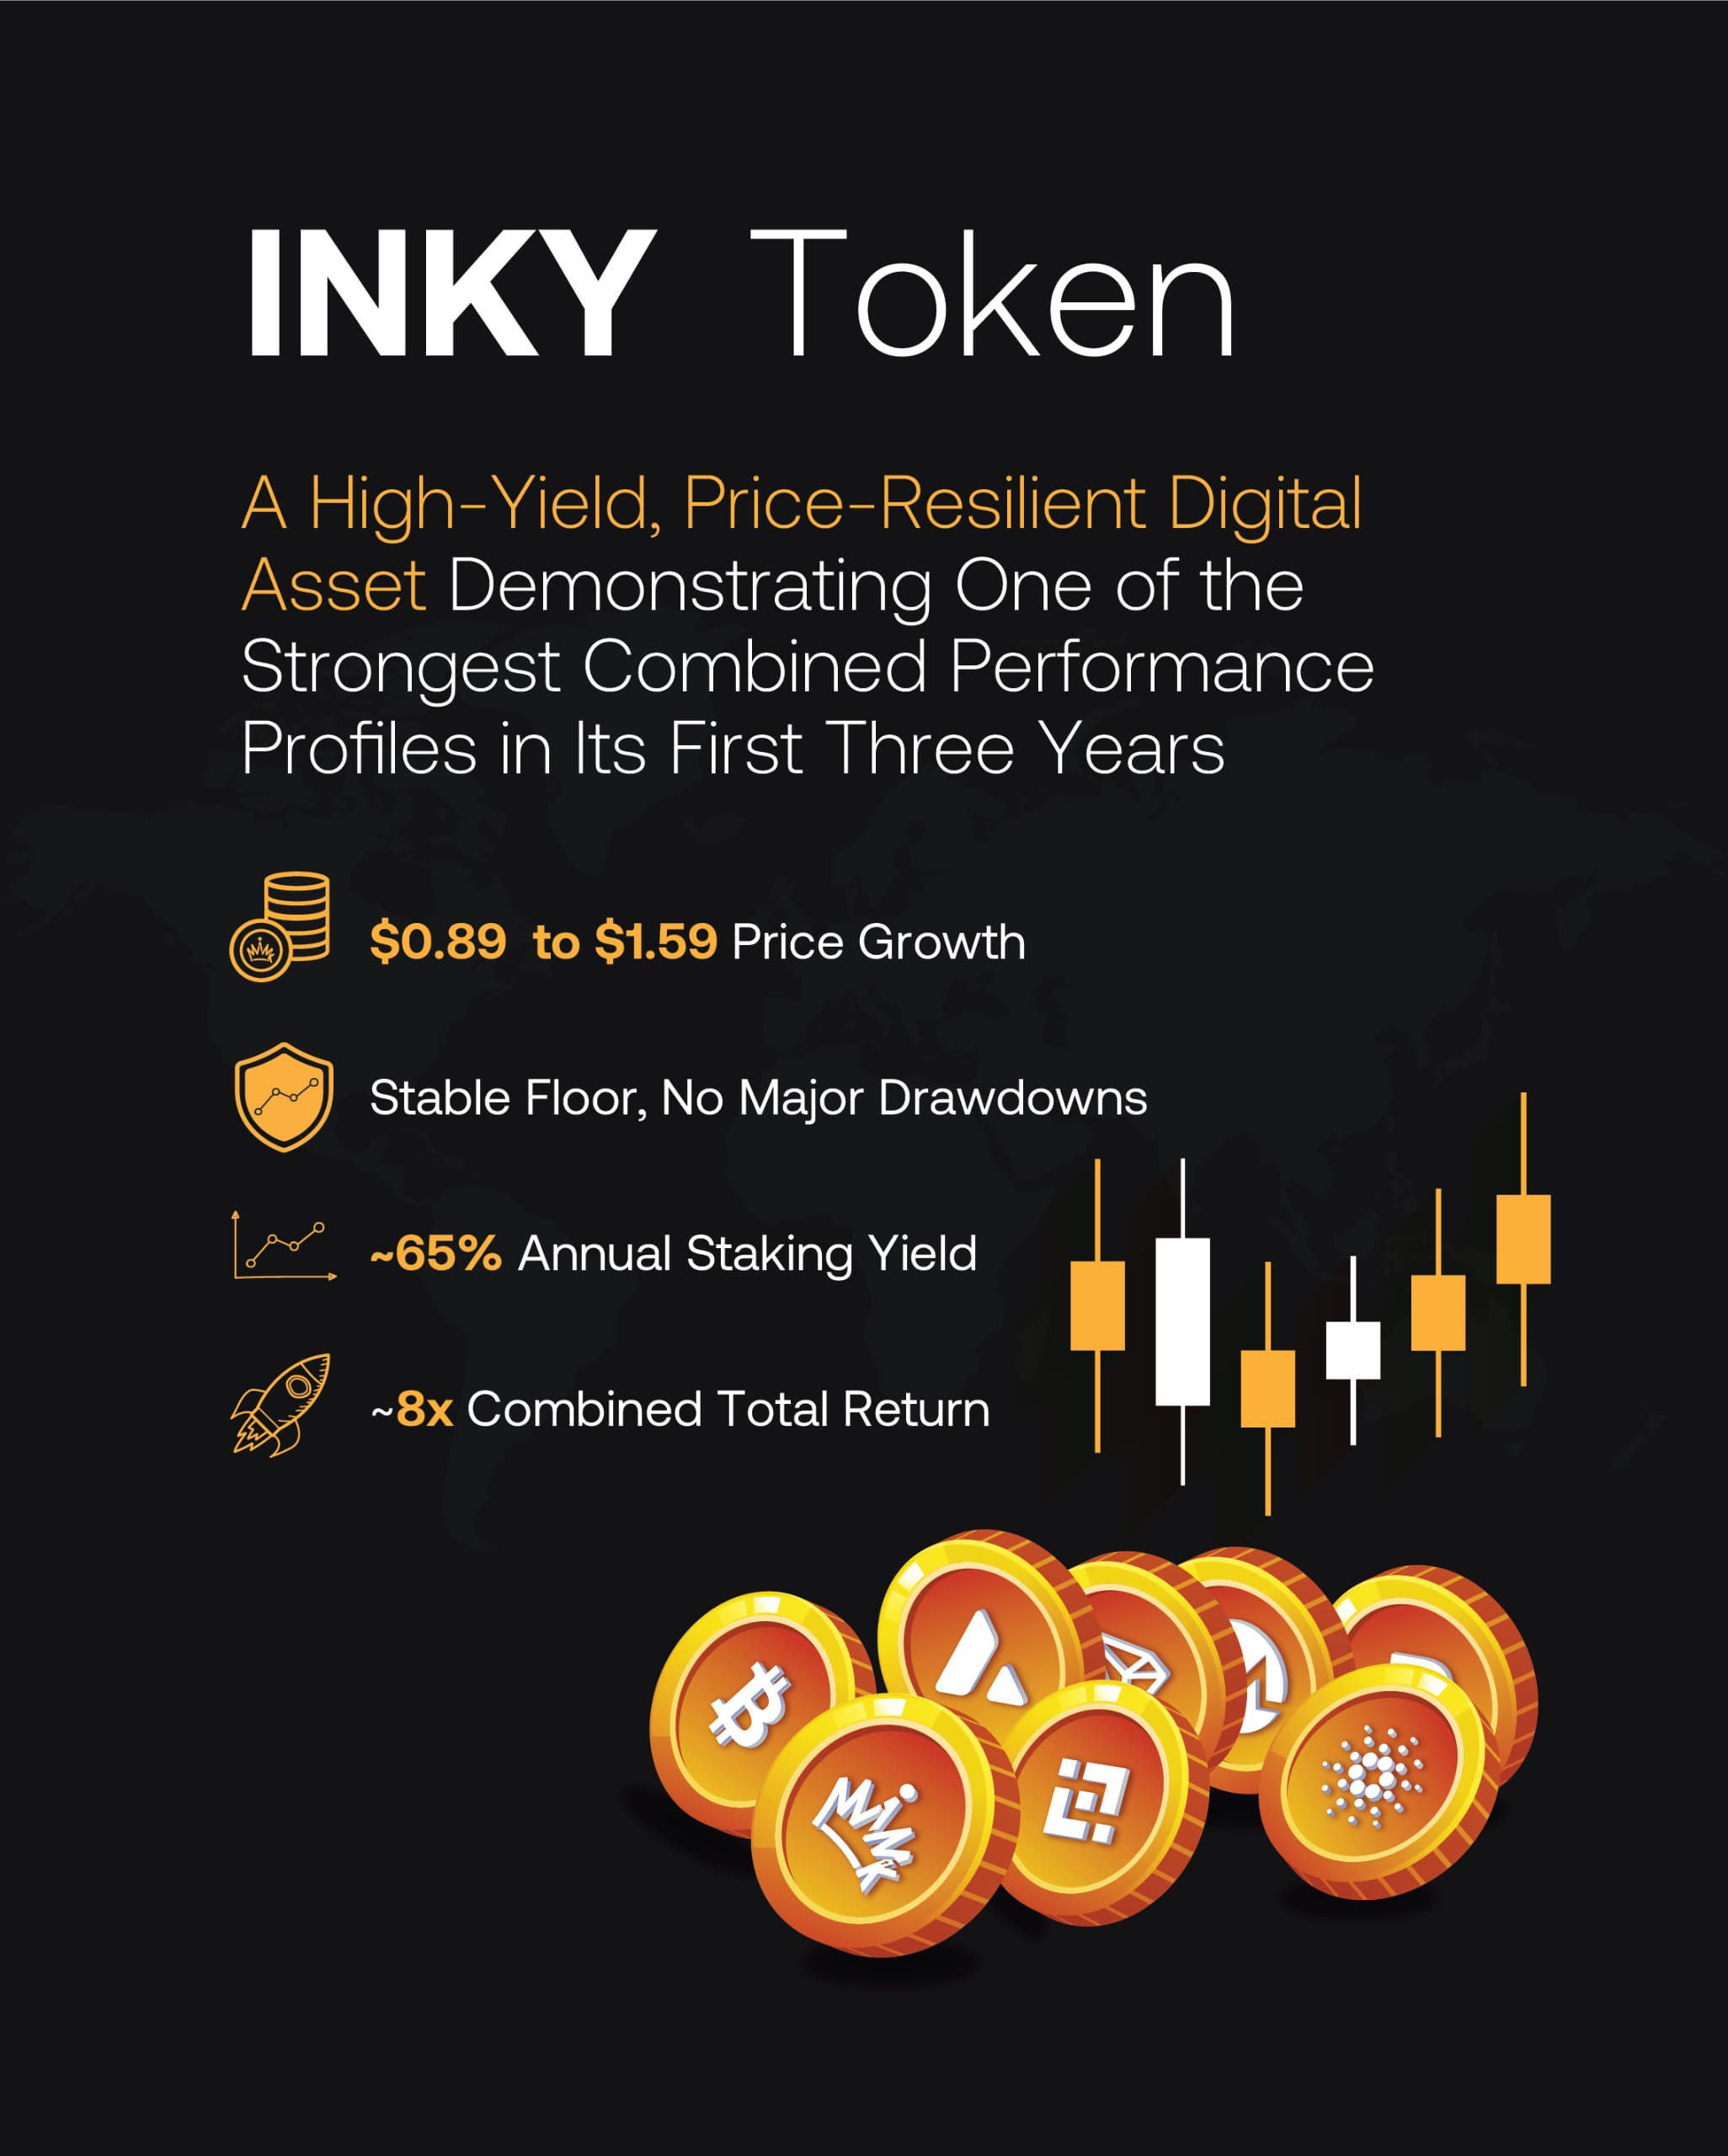
Over a three-year period, INKY has demonstrated a performance profile that stands out among crypto assets exhibiting share-like characteristics. By combining sustained high staking returns with controlled price behavior and open-market liquidity, it presents a model that differs from typical early-cycle token trajectories.
This article evaluates that performance through objective metrics.
Defining Share-Like Digital Assets
For analytical clarity, “share-like” crypto assets are defined as tokens that:
Exchange tokens and ecosystem-backed assets commonly fall into this category.
Exchange tokens such as BNB and KuCoin Token, as well as network tokens like Solana, are often categorized within this “share-like” class because their value proposition is linked to ongoing platform activity.
INKY belongs to this category. Over its first three years of market presence, it has demonstrated a performance profile defined by three measurable factors:
This article evaluates INKY within that comparative framework.
Defining the Evaluation Criteria
To ensure a structured and professional comparison, three dimensions are used:
1. Three-Year Total Return
Combined capital appreciation and staking yield (where applicable).
2. Price Stability
Downside behavior relative to initial listing range.
3. Yield Strength
Sustained annual return from staking or participation mechanisms.
INKY: Three-Year Performance Overview
Market Performance
Over approximately three years, the token has maintained trading levels near or above its listing range, without sustained breakdown below the early support zone.
Staking Yield
Compounded annually:
1.653 = 4.49
Staking alone would increase holdings approximately 4.49 times over three years.
Combined Performance
Price multiplier: ~1.79×
Yield multiplier (compounded): ~4.49×
Total≈8.0×
A $1 allocation at listing, compounded through staking, would approximate $8 after three years representing roughly +700% total growth.
Notably, the majority of this performance derives from productive yield rather than speculative price expansion.
Comparative Analysis: Established Share-Like Crypto Assets
1. BNB
Ecosystem Driver: Utility across exchange and blockchain ecosystem
Value Mechanism: Quarterly burn structure
Yield Structure: Earn programs available, not characterized by sustained 65% staking
BNB experienced significant early volatility before achieving large multi-cycle appreciation. While capital gains have historically been strong, its return profile is price-driven rather than yield-driven.
2. KuCoin Token (KCS)
Ecosystem Driver: Exchange participation
Value Mechanism: Revenue-linked bonus and buyback/burn
Yield Structure: Variable daily bonus tied to exchange trading activity
KCS represents one of the closest structural peers in terms of “share-like” behavior. However, its reward distribution operates differently from fixed high-APY staking models and is not typically structured around sustained 65% annual returns.
3. Solana (SOL)
Ecosystem Driver: Layer-1 blockchain network utility
Value Mechanism: Network demand and staking participation
Yield Structure: Native staking rewards (generally single-digit percentage ranges under typical conditions)
Solana has delivered significant capital appreciation during strong market cycles. However, it has also experienced substantial volatility and large historical drawdowns during its early years.
Comparative Summary Table
Structural & Performance Comparison (Three-Year Lens)
Asset | Price Resilience | Yield Strength | Primary Return Driver | Combined Profile |
INKY | Maintained listing floor | ~65% annual staking | Yield + moderate price growth | High composite balance |
BNB | Volatile early cycles | Limited staking yield | Capital appreciation | Price-dominant |
KCS | Cyclical volatility | Revenue-linked bonus | Price + bonus | Moderate balance |
SOL | High volatility | Single-digit staking | Capital appreciation | Price-dominant |
Objective Ranking Framework
Using the three evaluation dimensions (Total Return, Stability, Yield Strength), a composite score can be constructed:
Asset | 3Y Total Return | Stability | Yield Strength | Composite |
INKY | 4 | 5 | 5 | 14 / 15 |
BNB | 5 | 2 | 2 | 9 |
KCS | 3–4 | 3 | 2–3 | 8–10 |
SOL | 4–5 | 2 | 2 | 8–9 |
This ranking reflects the following:
This ranking reflects the following:
Performance Classification
Historically, early-stage crypto assets tend to fall into one of three profiles:
INKY’s observed three-year record reflects a fourth model:
Sustained high yield combined with maintained price stability and open-market tradability.
Based on the confirmed data, INKY reflects a fourth model:
Sustained high yield combined with controlled price behavior and open-market liquidity.
This combination is relatively uncommon in early-cycle digital assets.
Conclusion
When evaluated systematically against established share-like crypto assets such as BNB, KCS, and SOL, INKY demonstrates one of the strongest combined yield-stability profiles within its early lifecycle.
Over approximately three years, it has shown:
While other tokens may exceed it in pure capital expansion during bull cycles, the integration of productivity, resilience, and duration positions INKY as a distinctive case among share-structured digital assets, this blended performance profile warrants analytical attention.
0 comments